The ultimate investment management tool, providing a dynamic and intuitive platform for investors to track and optimize their portfolios with ease.
Portfolio Comparison
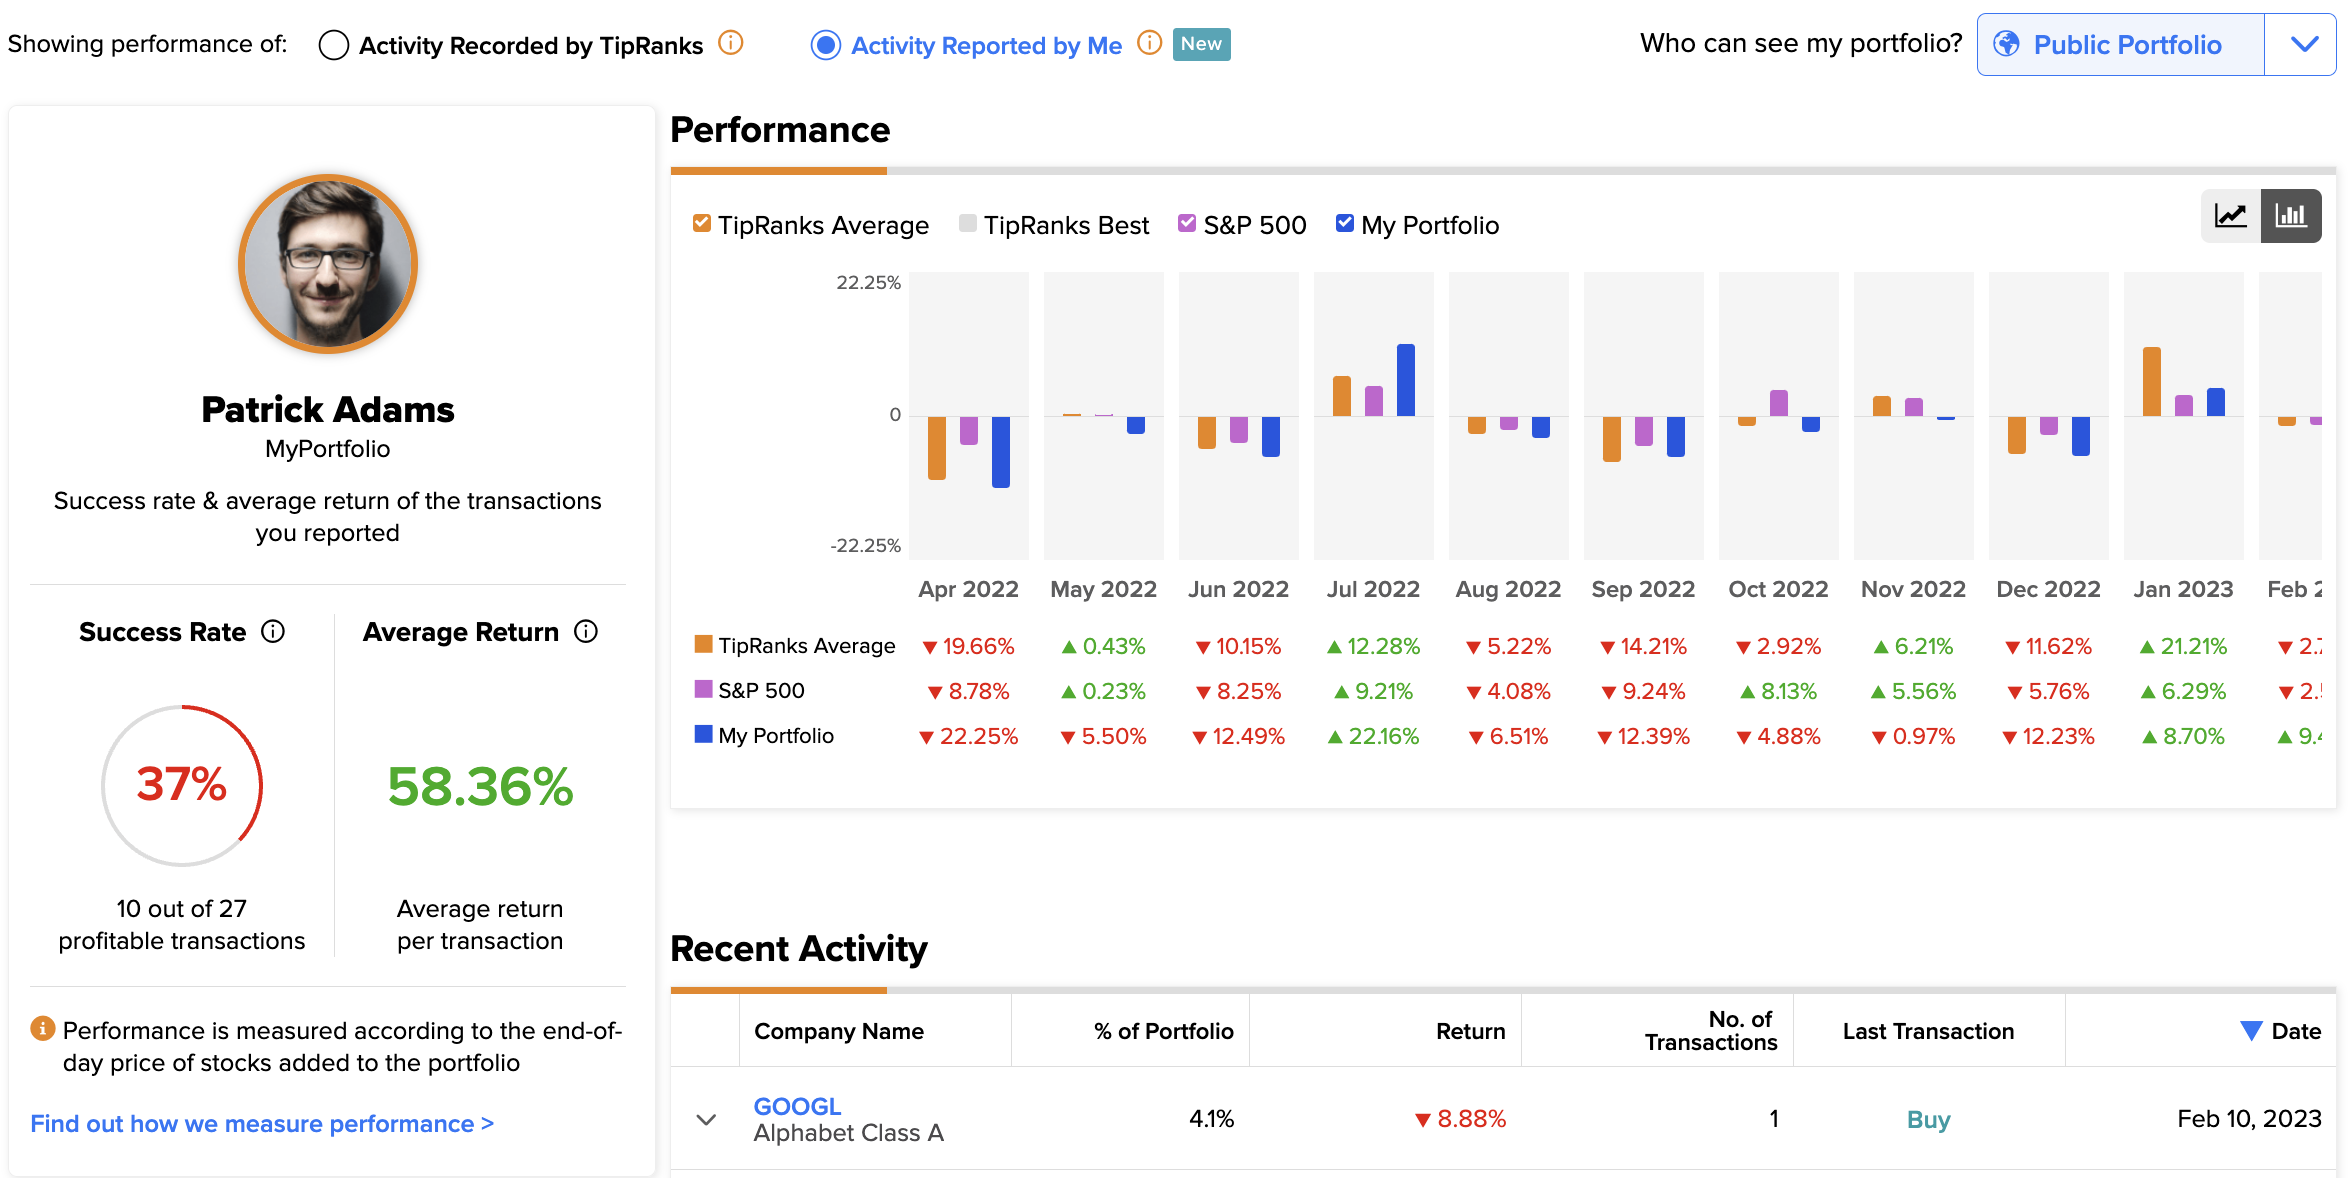
TipRanks gives investors a comparison of their portfolio’s performance against the aggregate performance of all portfolios held on TipRanks’ Smart Portfolio. We give each investor individualized bar charts, indicating comparisons to TipRanks’ best investors, TipRanks’ average investors, and the S&P 500.
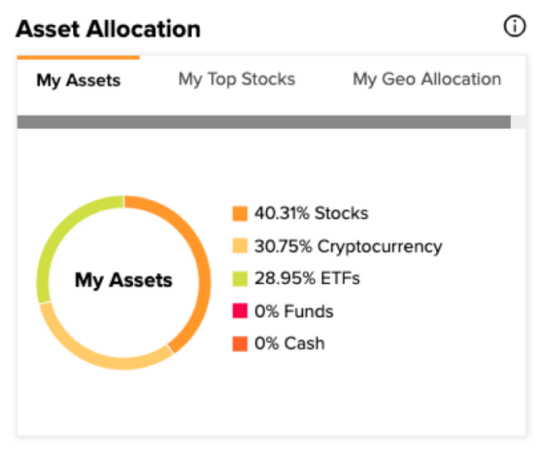
A clear, graphical view of the breakdown of asset types an investor’s portfolio holds. At a glance, investors will see the percentage of their portfolios held in stocks, ETFs, cryptocurrency, funds and cash.
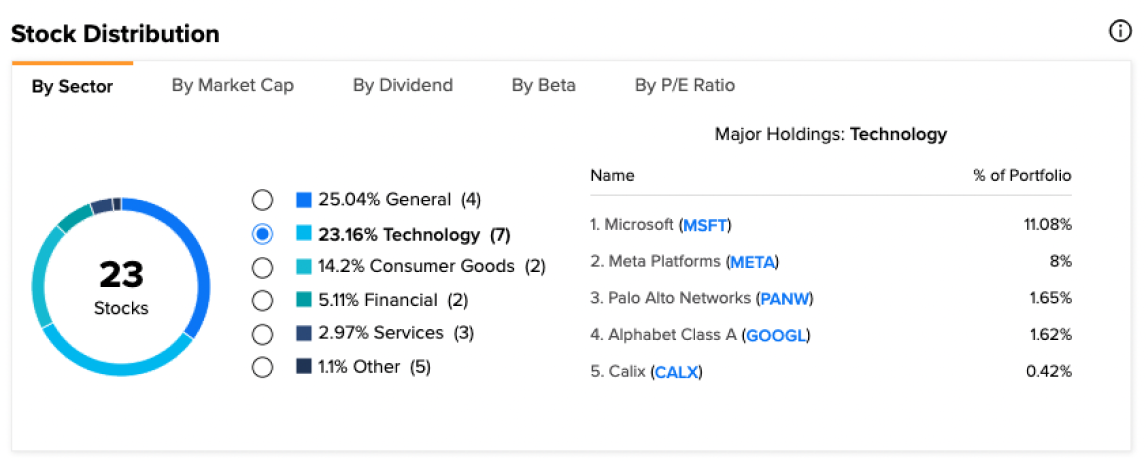
A clear, graphical view of the breakdown of sectors for the stocks held in each investor’s portfolio. Investors will easily learn what percentage of their portfolios are in each sector, such as the Technology and Utilities sectors.
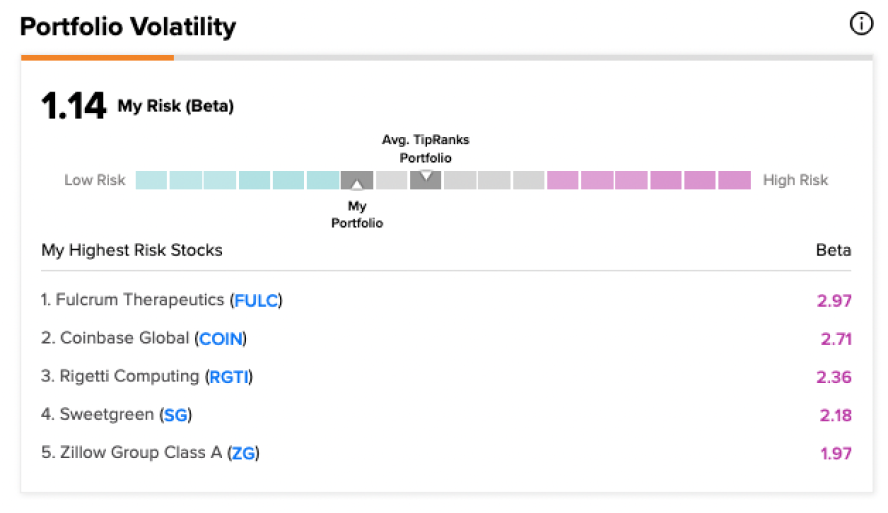
An indication of the level of volatility of each individual stock in investors’ portfolios, as well as the volatility of the overall portfolio. Includes a chart showing the most volatile stocks in the portfolio, and the Beta on the portfolio.
TipRanks displays the current dividend yield on each stock held in investors’ portfolios, along with the aggregate dividend yield of all stocks in their portfolios. We also show investors a chart of their upcoming dividends and their estimated annual dividend payment.
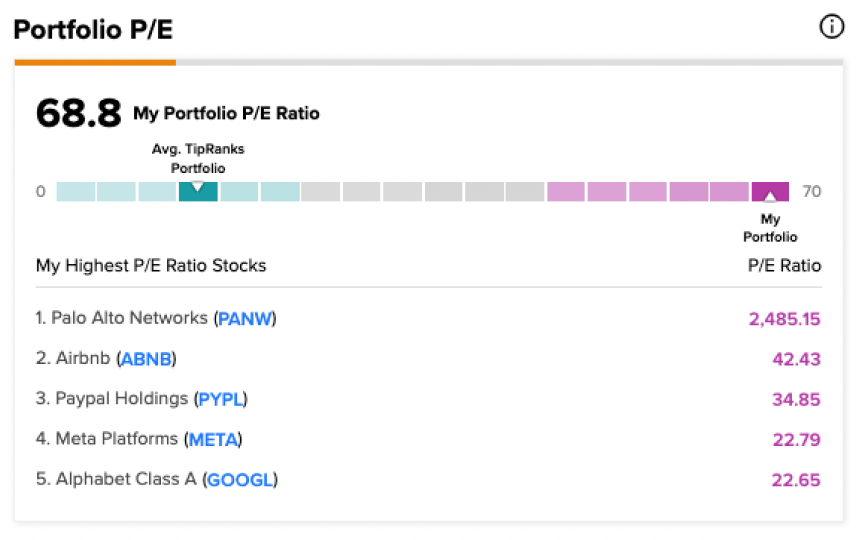
TipRanks calculates the current P/E (price over earnings) ratio on the aggregate of all stocks in an investor’s portfolio, and compares it to the P/E of the average portfolio. A chart shows investors their holdings with the highest P/E ratio.